|
AVHRR
|
||||||||||||||||||||||||||||||||||||||||||||||||||||||||||||||||||||||||||
|
Introduction
The Advanced Very High Resolution Radiometer (AVHRR) is a cross-track scanning system with five spectral bands having a resolution of 1.1 km and a frequency of earth scans twice per day (0230 and 1430 local solar time). There are three data types produced from the POES AVHRR. The Global Area Coverage (GAC) data set is reduced resolution image data that is processed onboard the satellite taking only one line out of every three and averaging every four of five adjacent samples along the scan line; the Local Area Coverage (LAC) data set is recorded onboard at original resolution (1.1 km) for part of an orbit and later transmitted to earth; and the High Resolution Picture Transmission (HRPT) is real-time downlink data. A fourth data type, Full Resolution Area Coverage (FRAC 1.1 km) is now available daily for the entire globe with the launch of MetOp-A, on October 19, 2006, Europe's first polar orbiting operational meteorological satellite system and the first of the European contribution to the Initial Joint Polar-Orbiting Operational Satellite System (IJPS). The visible channel data may be converted into albedos and the IR data into radiances or temperatures using the calibration information which is appended but not applied. Earth location values are also appended to the data files. The level 1b data files are archived in 10 bit packed binary format but can be delivered as 16 bit format with our without the archive headers. Other parameters that are appended are: time codes, quality indicators, solar zenith angles, and telemetry. For an indepth review of the data formats please see https://www.ncei.noaa.gov/pub/data/satellite/publications/podguides/ |
||||||||||||||||||||||||||||||||||||||||||||||||||||||||||||||||||||||||||
|
Applications
The objective of the AVHRR instrument is to provide radiance data for investigation of clouds, land-water boundaries, snow and ice extent, ice or snow melt inception, day and night cloud distribution, temperatures of radiating surfaces,sea surface temperature and vegetation classification and greenness, through passively measured visible, near infrared and thermal infrared spectral radiation bands. The instrument channelization has been carefully selected to permit multispectral analyses which provide improved determination of hydrologic, oceanographic, and meteorological parameters. The visible (0.5 micron) and visible/near IR (0.9 micron) channels are used to discern clouds, land-water boundaries and snow and ice extent. When the data from the two channels are compared vegetation health can be computed and ice/snow melt inception indicated. The IR window channels are used to measure cloud distribution and to determine the temperature of the radiating surface (cloud or surface). Data from the two IR channels is incorporated into the computation of sea surface temperature. By using these two channels, it is possible to remove an ambiguity introduced when clouds fill a portion of the field-of-view. On later instruments in the series, a third IR channel was added which gave scientists the capability of removing radiant contributions from water vapor and that allowed determining surface temperatures with higher accuracy and confidence. Prior to inclusion of this third channel, corrections for water vapor contributions were based on statistical means using climatological estimates of water vapor content. AVHRR data have been used for many diverse applications. In general, as stated earlier, AVHRR applications encompass many aspects of environmantal uses. Obvious meteorological and climatological applications include detection and analysis of cold fronts, smoke and ash plumes, weather systems, cloud movement, squall lines, boundary clouds, jet stream, cloud climatology, floods and hurricanes. In addition, land use applications of the AVHRR include monitoring of food crops, volcanic activity, forest fires, deforestation, vegetation health, snow cover extent, sea ice extent, desert encroachment, icebergs, oil prospecting and geology applications. Other miscellaneous AVHRR applications include the monitoring of migratory patterns of various animals, animal habitats, environmental impacts from human activities, climate change and insect infestations. |
||||||||||||||||||||||||||||||||||||||||||||||||||||||||||||||||||||||||||
|
Data Acquisition
NOAA POES and EUMETSAT's Metop satellites obtain global imagery daily and are sent to designated receiving stations worldwide. These data are relayed to the NOAA Satellite Operations Facility located in Suitland, Maryland, for processing and distribution. As a result of the design of the AVHRR scanning system, the normal operating mode of the satellite calls for direct transmission to Earth (continuously in real-time) of AVHRR data. This direct transmission is called HRPT (High Resolution Picture Transmission). In addition to the HRPT mode, about 11 minutes of data per orbit are selectively recorded on the POES series for later playback. These recorded data are referred to as LAC (Local Area Coverage) data. LAC and HRPT datatypes have identical Level 1b formats. The full resolution data are also processed on board the satellite into GAC (Global Area Coverage) data which are recorded only for readout by NOAA's CDA stations. GAC data are reduced resolution data. The data volume and resolution are further reduced by averaging every four adjacent samples and skipping the fifth sample along the scan line. With the launch of Metop satellites Full Resolution Area Coverage (FRAC) is now available for the entire globe. However, users can still obtain the Global Area Coverage (GAC) from CLASS to maintain continuity in the climate records. The POES and Metop satellites operate in relatively low orbits, ranging from 830 to 870 km above the earth. They circle the earth approximately 14 times per day (with orbital periods of about 102 minutes). The orbits are timed to allow complete global coverage twice per day, per satellite (normally a daytime and a nighttime view of the earth) in swaths of about 2,600 km in width. High resolution (1 kilometer) data are transmitted from the satellite continuously, and can be collected when the satellite is within range of a receiving station. For the NOAA POES satellites there are recorders on board the satellites to store data at a reduced resolution of 4 kilometers, and a limited amount of data at 1 kilometer resolution. The recorders are dumped when the satellite is within range of a NOAA receiving station. |
||||||||||||||||||||||||||||||||||||||||||||||||||||||||||||||||||||||||||
|
Data Description
AVHRR Level 1b data are grouped into four data types: HRPT, LAC, GAC and FRAC. FRAC applies only to Metop satellites. GAC data are available globally since about 1978. The LAC and HRPT data types are most complete from 1985 forward and are limited to specific areas of the world. As a general rule, HRPT data are available for the U.S. and coastal areas, whereas the LAC data are available over non-U.S. land masses, particularly over grain producing areas. FRAC data is available for the entire globe since late October 2006. The NOAA AVHRR data that is archived processed to Level 1b, following FGGE terminology, with 10 bit precision. These data have been quality controlled and assembled into discrete data sets by full orbits with some exceptions. Each file contains appended Earth location and calibration information, which can be applied by the user. Other parameters that are appended are: time codes, quality indicators, solar zenith angles, and telemetry. |
||||||||||||||||||||||||||||||||||||||||||||||||||||||||||||||||||||||||||
|
Spatial Coverage
The AVHRR provides a global (pole-to-pole) on-board collection of data from 4 to 5 spectral channels. At an 833 km altitude, the 110.8 degree scan equates to a swath 27.2 degrees in width (at the Equator),or 2,600 km, centered on the subsatellite track. This swath width is greater than the 25.3 degree separation between successive orbital tracks, providing overlapping coverage (side-lap). For LAC, HRPT, and FRAC the instantaneous field-of-view (IFOV) of each channel is approximately 1.4 milliradians (mr) leading to a resolution at the satellite subpoint of 1.1 km for a nominal altitude of 833 km. Since GAC data contain only one out of three original AVHRR lines and the data volume and resolution are further reduced by averaging every four adjacent samples and skipping the fifth sample along the scan line, the effective resolution is 1.1 x 4 km with a 3 km gap between pixels across the scan line. This is generally referred to as 4 km resolution. |
||||||||||||||||||||||||||||||||||||||||||||||||||||||||||||||||||||||||||
|
Temporal Coverage
Each scan of the AVHRR views the Earth for a period of 51.282 milliseconds (msec). The analog data output from the sensors is digitized on-board the satellite at a rate of 39,936 samples per second per channel. Each sample step corresponds to an angle of scanner rotation of 0.95 milliradian (mr). At this sampling rate, there are 1.362 samples per IFOV. A total of 2,048 samples for the LAC/HRPT/FRAC data are obtained per channel per Earth scan, which spans an angle of +/- 55.4 degrees from the nadir (subpoint view). Successive scans occur at the rate of 6 per second, or at intervals of 167 msec. For GAC data, successive sets of 4 out of every 5 samples in every third scan line are averaged to obtain an array of data spaced at intervals of 125 msec along the scan and at 500 msec along the satellite track. This leads to a data rate of 49,080 samples-per-minute and 2 scans-per-second. There are a total of 409 samples for the GAC data per channel per Earth scan. Because the satellite is sun-synchronous, visible data revisit time is daily. Infrared imaging is accomplished twice daily with the second visit occurring during the pass over the dark side of the Earth. Instrument operation is continuous. The following table shows the launch date and the overall data availability in CLASS for each satellite. The actual archived data period of record will vary by datatype and there will likely be some data gaps due to a number of reasons.
| ||||||||||||||||||||||||||||||||||||||||||||||||||||||||||||||||||||||||||
|
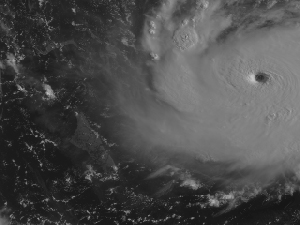
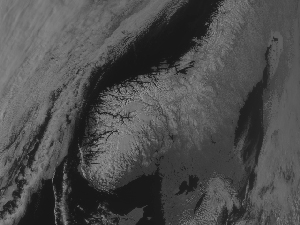
Browse Imagery
CLASS offers an on-line digital image browse feature for selected satellite image data sets. This image browse feature is primarily intended to support data set selection for order, by allowing users to visually judge overall image quality, determine the extent of cloud cover, and/or verify geographic coverage. The first satellite image data set to be supported with the browse feature is the AVHRR Level 1B data set. The sample browse images below show Hurricane Andrew and Norway.
|
||||||||||||||||||||||||||||||||||||||||||||||||||||||||||||||||||||||||||
|
Links to Documentation
Detailed information on the AVHRR and AVHRR/2 sensor and data formats for satellites TIROS-N through NOAA-14 can be found at: https://www.ncei.noaa.gov/pub/data/satellite/publications/podguides/TIROS-N%20thru%20N-14/ Detailed information on the AVHRR/3 and AVHRR/4 sensor and data formats for satellites NOAA-15 through NOAA-19 and Metop-A through Metop-C can be found at: https://www.ncei.noaa.gov/pub/data/satellite/publications/podguides/N-15%20thru%20N-19/ Satellite Data Readers There are several sources of AVHRR data readers and converters available to the CLASS user. For a listing of commercial readers please go to the FAQ section in CLASS - second from last bullet item. A freeware reader we have heard about is available at SatSignal for HRPT data type. It even mentions using data from CLASS. |
||||||||||||||||||||||||||||||||||||||||||||||||||||||||||||||||||||||||||